Brief No. VI Fabric Economics

Why
Polyester
Won.

March 2025 Data: 1992–2022 Monthly FRED · World Bank · BLS
72%

Average cotton price premium over polyester per kilogram, 1992–2022. Cotton has never been the cheap option in modern global markets.

6.6×

How much more volatile cotton is year-over-year versus polyester. Cotton swings ±30% annually; polyester swings ±5%.

22%

Natural fiber's share of global apparel production in 2022 — an all-time low, hit the same year Xinjiang sanctions disrupted cotton supply chains.

Cotton costs 72% more per kilogram than polyester — and it's 6.6 times more volatile. That's not a sustainability story. It's a supply chain survival story.

Between 1992 and 2022, polyester displaced cotton as the dominant fiber in global apparel production. This brief traces that shift through 30 years of monthly price data, separates noise from signal, and maps the exact events that made cotton operationally untenable for fast-moving supply chains. What emerges is a framework for reading fabric economics as a leading indicator — not a lagging one.

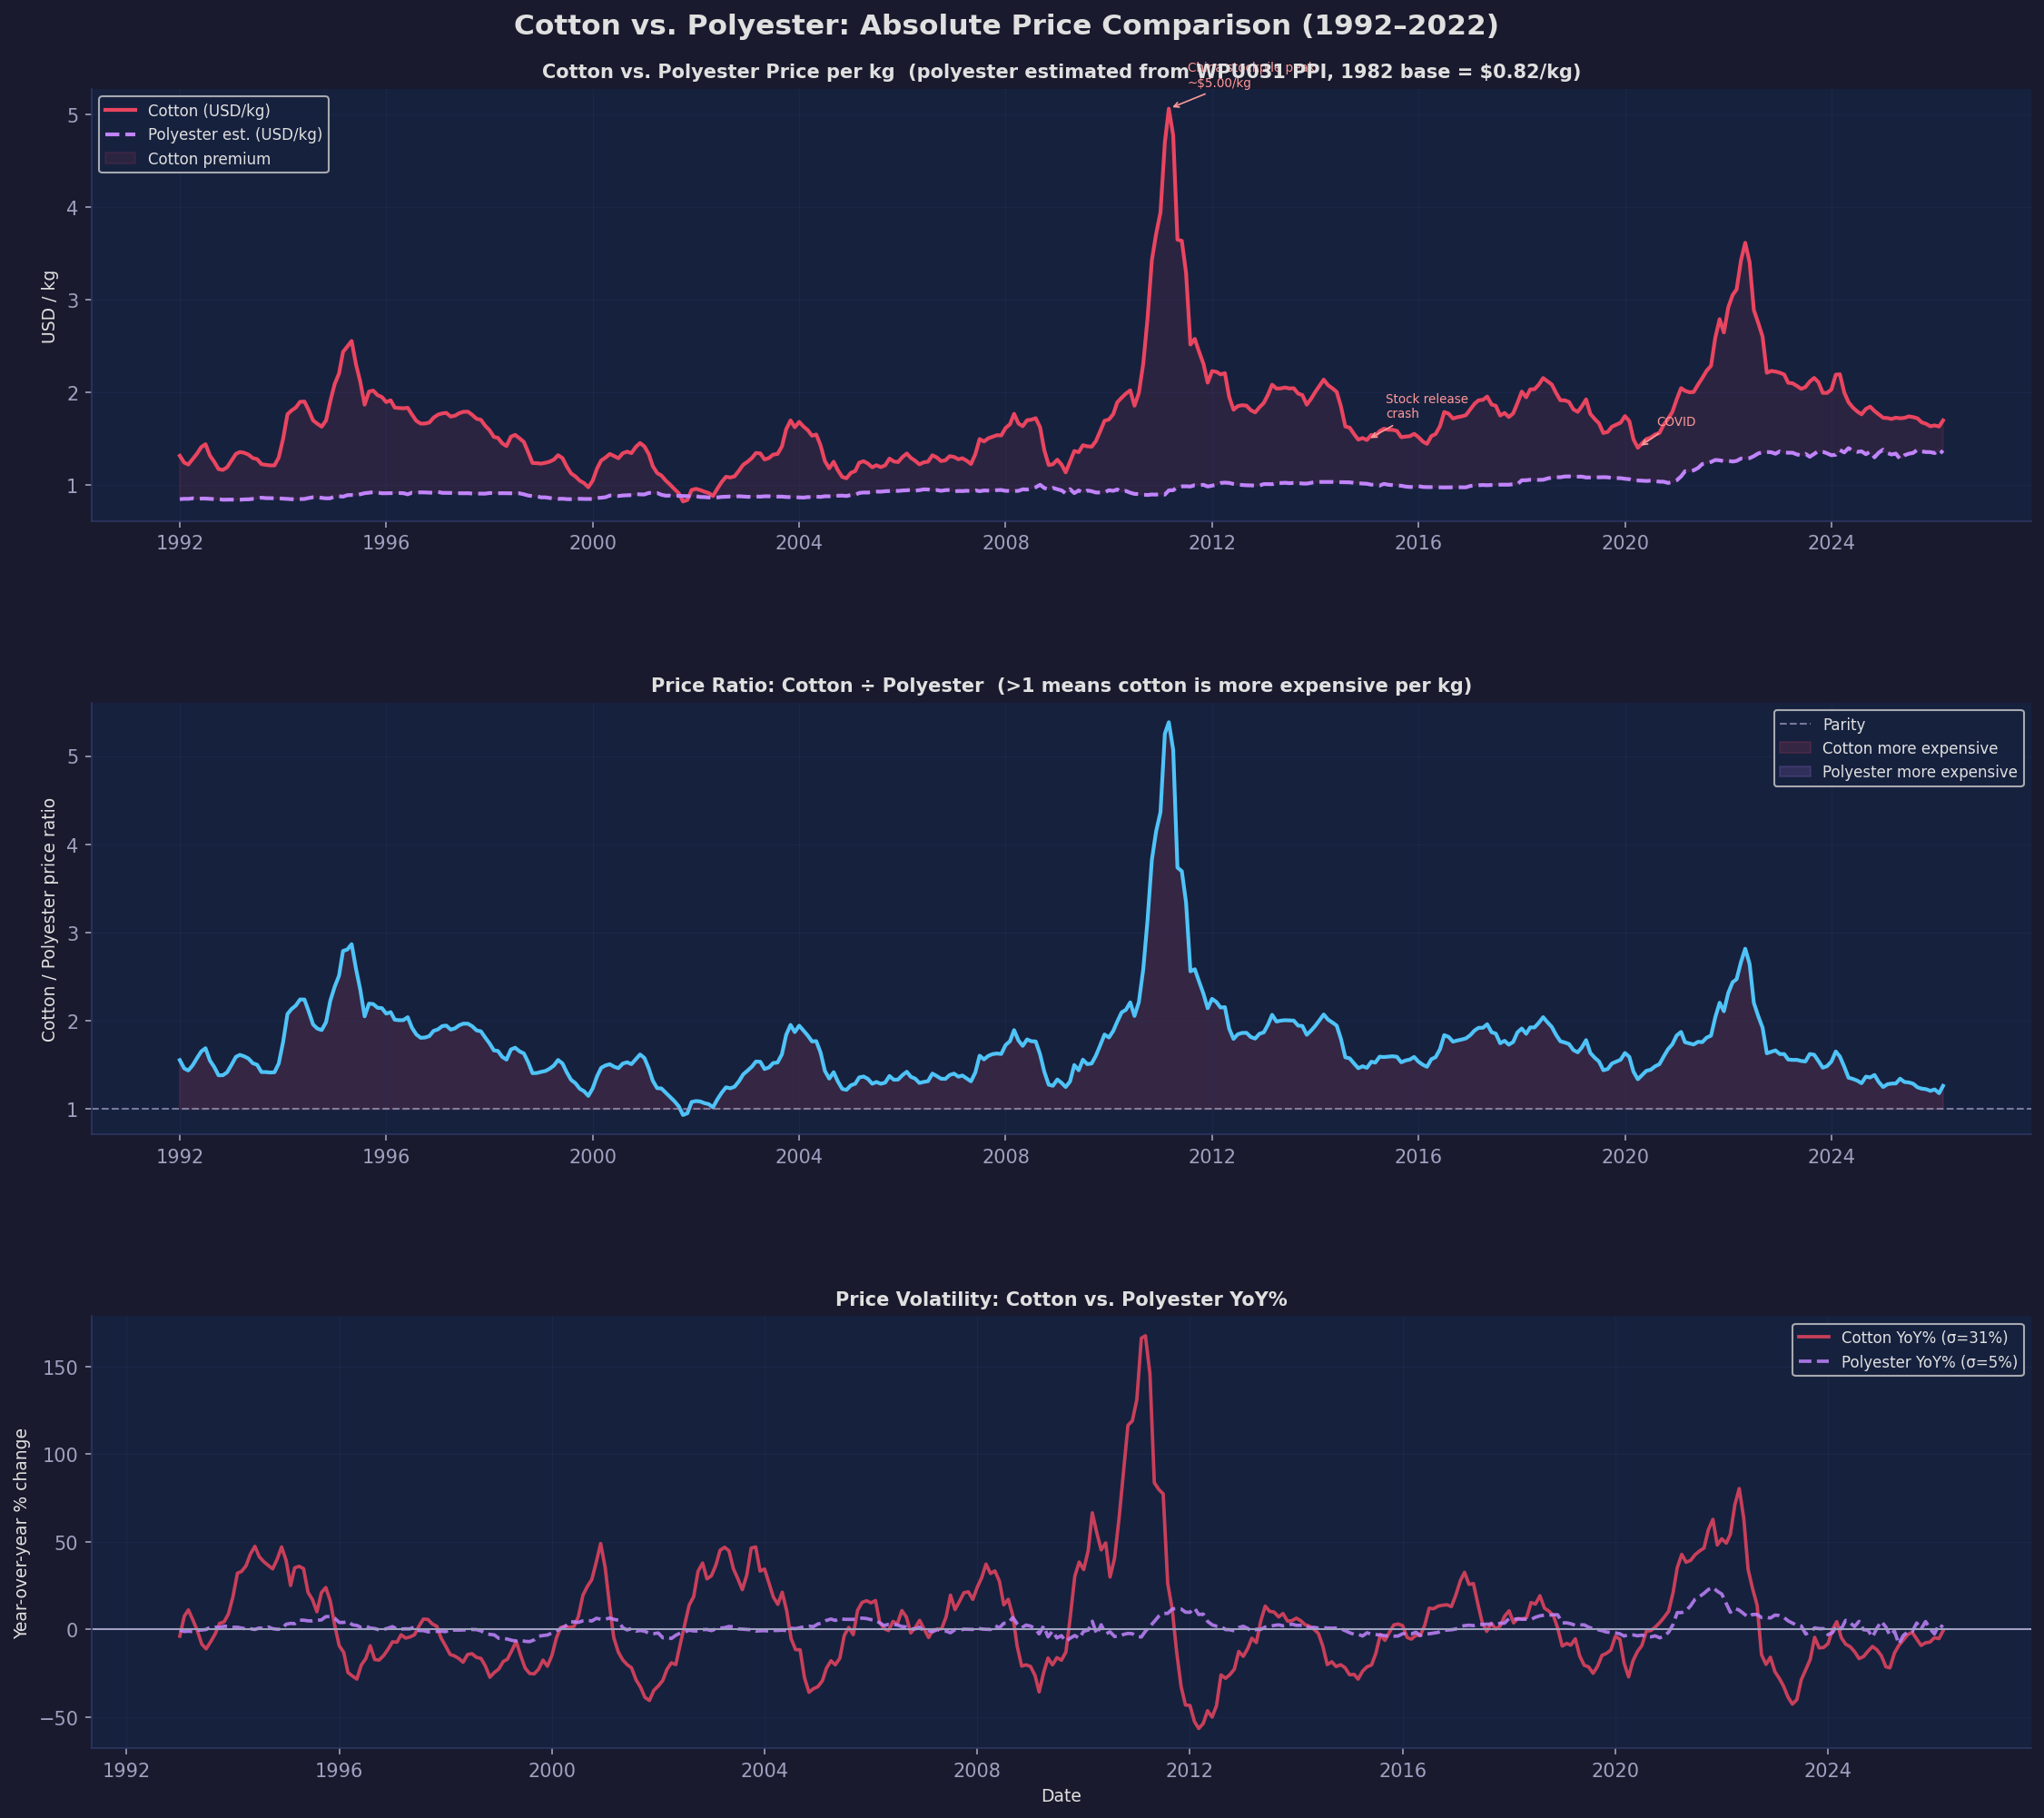
Fig. I Cotton vs. Polyester Price, 1992–2022 · USD / kg · Monthly
Cotton vs polyester price 1992–2022

Cotton was above polyester for the entire 1992–2022 period except briefly in 2001–2002. At the 2011 peak (China stockpile program), cotton reached $5.06/kg — more than 5× polyester's price at the time. Source: World Bank A-Index (PCOTTINDUSDM) via FRED; FRED WPU031 Synthetic Fiber PPI.

Three Reasons
Cotton Lost

1. Price. Cotton has cost 72% more per kg on average since 1992. At the 2011 peak — driven by China's government stockpile accumulation — cotton hit $5.06/kg, more than 5× polyester's price at that moment. Even at its cheapest (2001–2002: $0.82/kg), cotton was barely at parity with polyester, and that window lasted only 18 months before bouncing back. In globalized markets, cotton has never reliably been the cheap option.

2. Volatility. Cotton is 6.6× more volatile year-over-year than polyester. Cotton swings ±30% in a typical year; polyester swings ±5%. For fast fashion supply chains running on 3–6 month lead times and razor-thin margins, that volatility is operationally destructive. Manufacturers locked into cotton contracts got wiped out in 2011. Manufacturers running polyester had almost no price risk to manage.

3. Supply reliability. Polyester has no crop. No weather risk, no land competition, no harvest season. Cotton is exposed to drought (US), floods (Pakistan), government policy (China's stockpile and release cycle), export bans (India), and trade sanctions (Xinjiang). Every one of those events created price spikes and supply gaps that pushed buyers toward synthetics.

Cotton's price drivers are a compound of weather, geopolitics, agricultural policy, trade law, and currency. None of these have a polyester equivalent. Polyester's price drivers are narrow: oil cost and manufacturing overcapacity. That narrowness makes polyester predictable. Cotton's multi-factor exposure makes it structurally unreliable at scale — and that's the actual reason it lost market share.
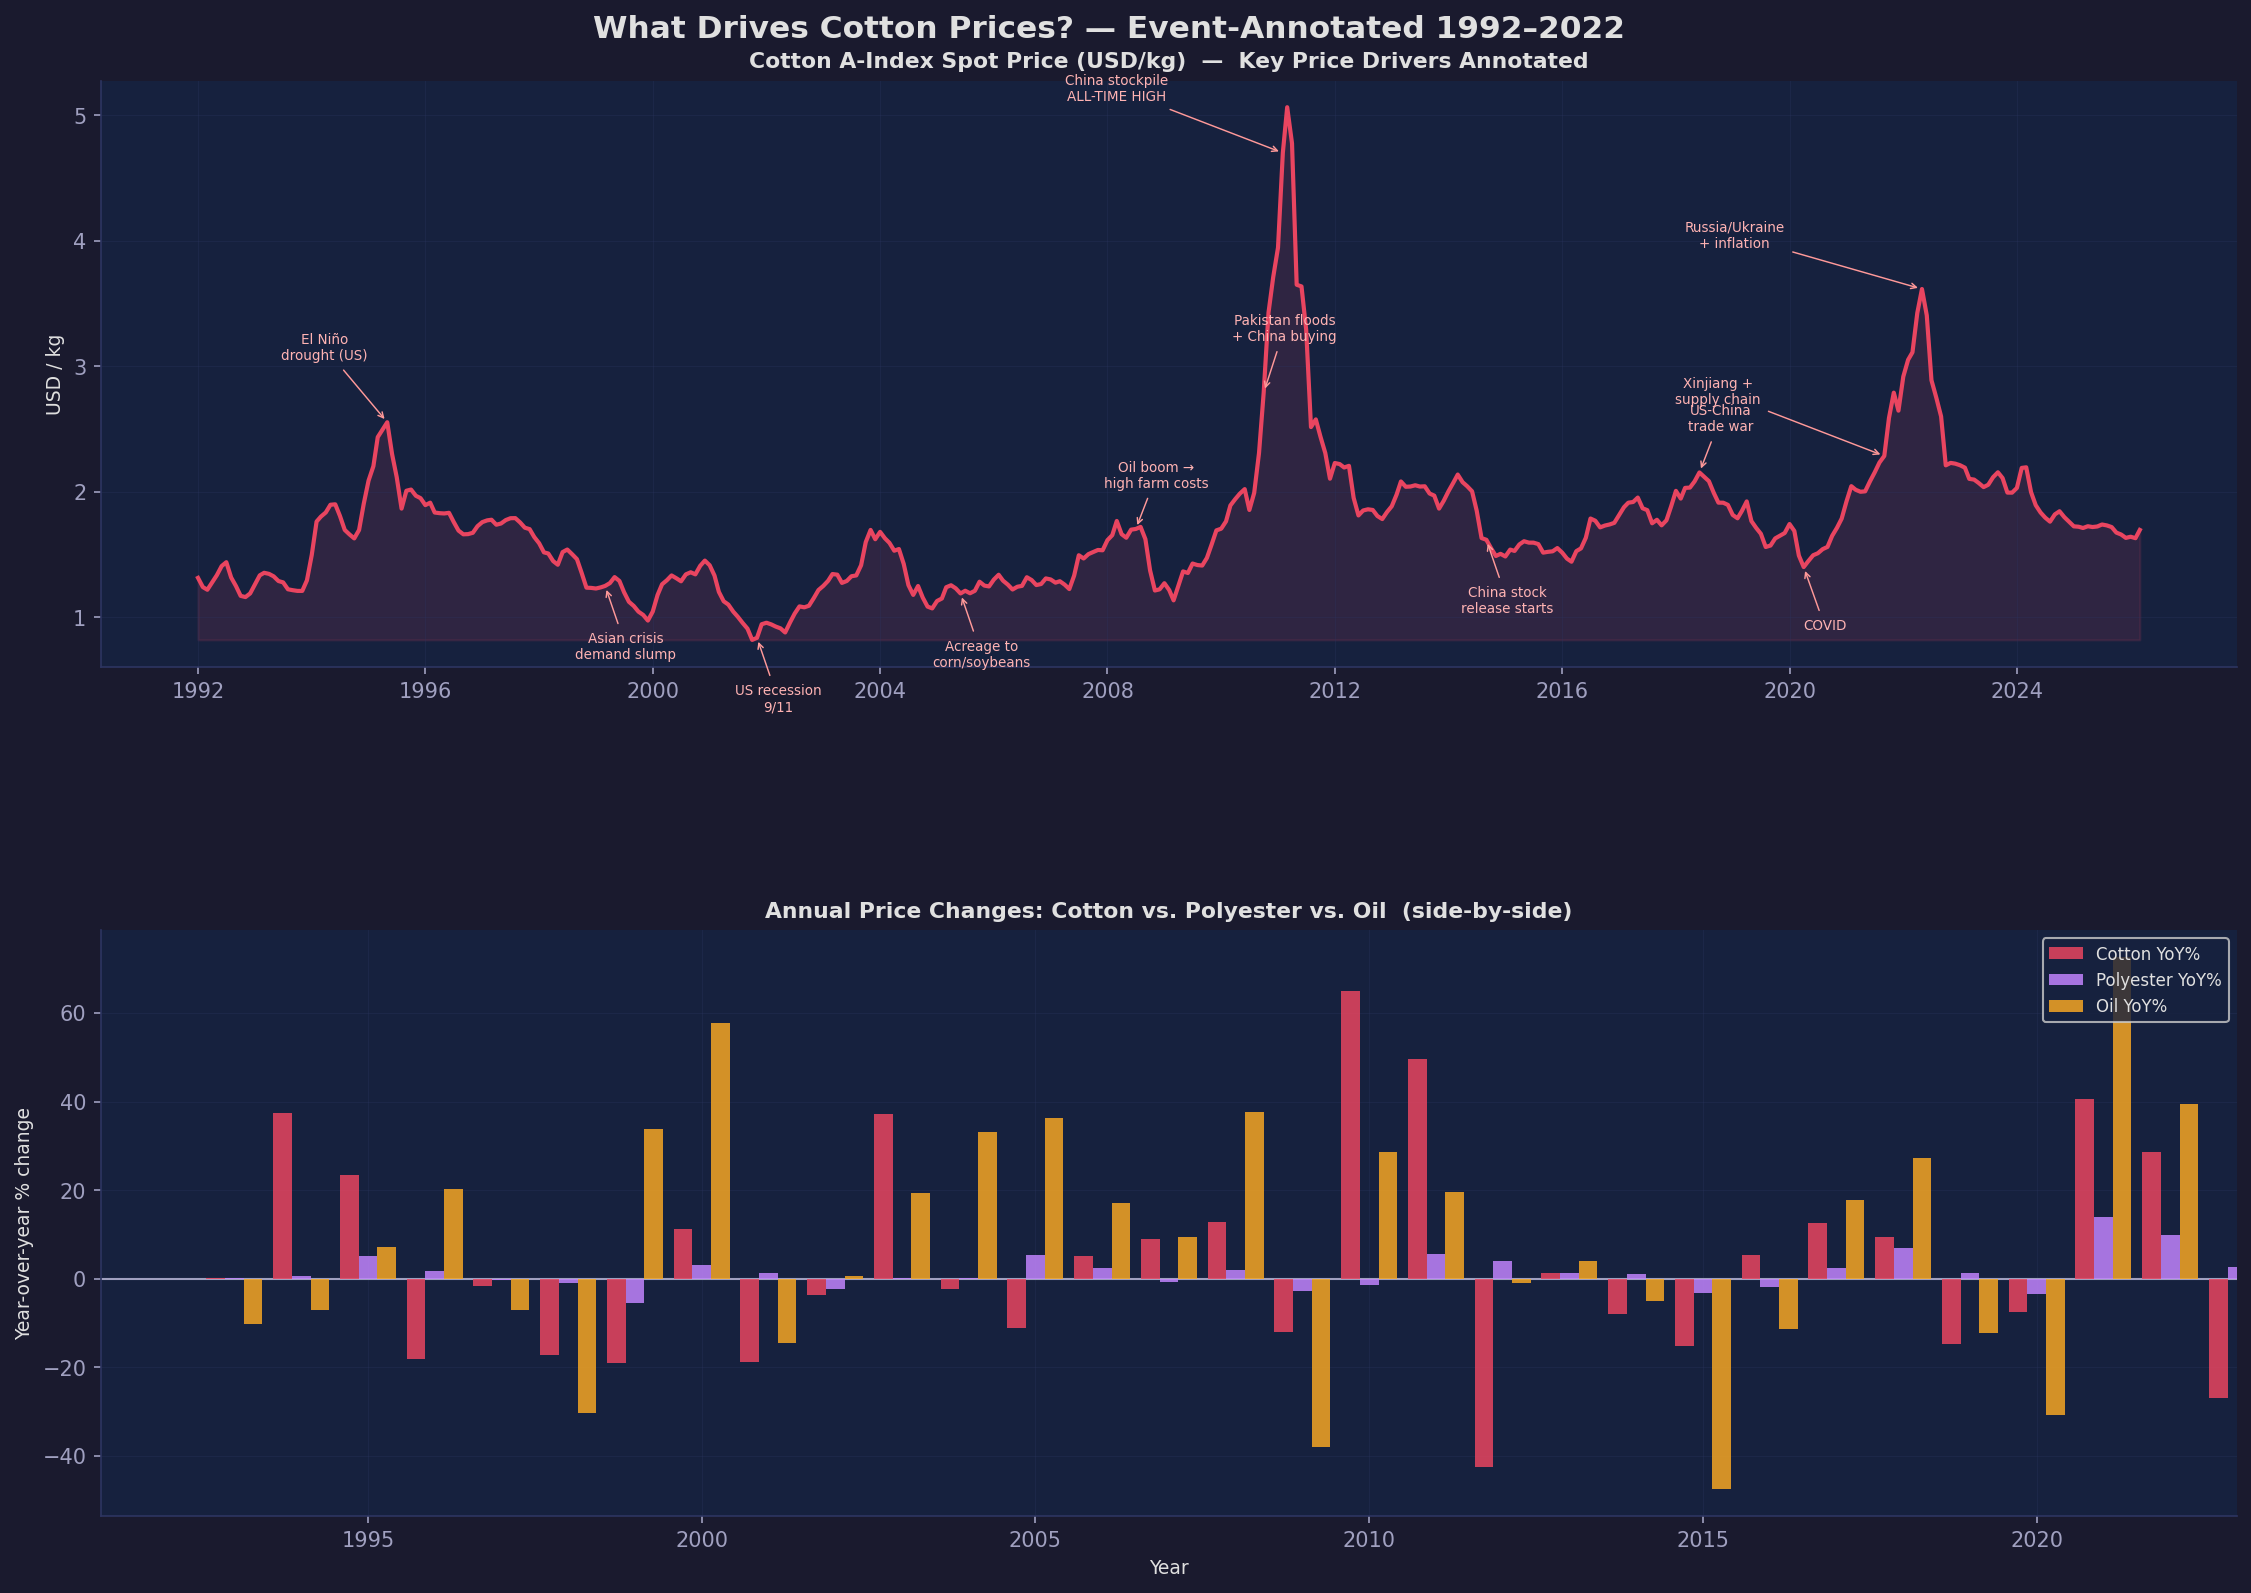
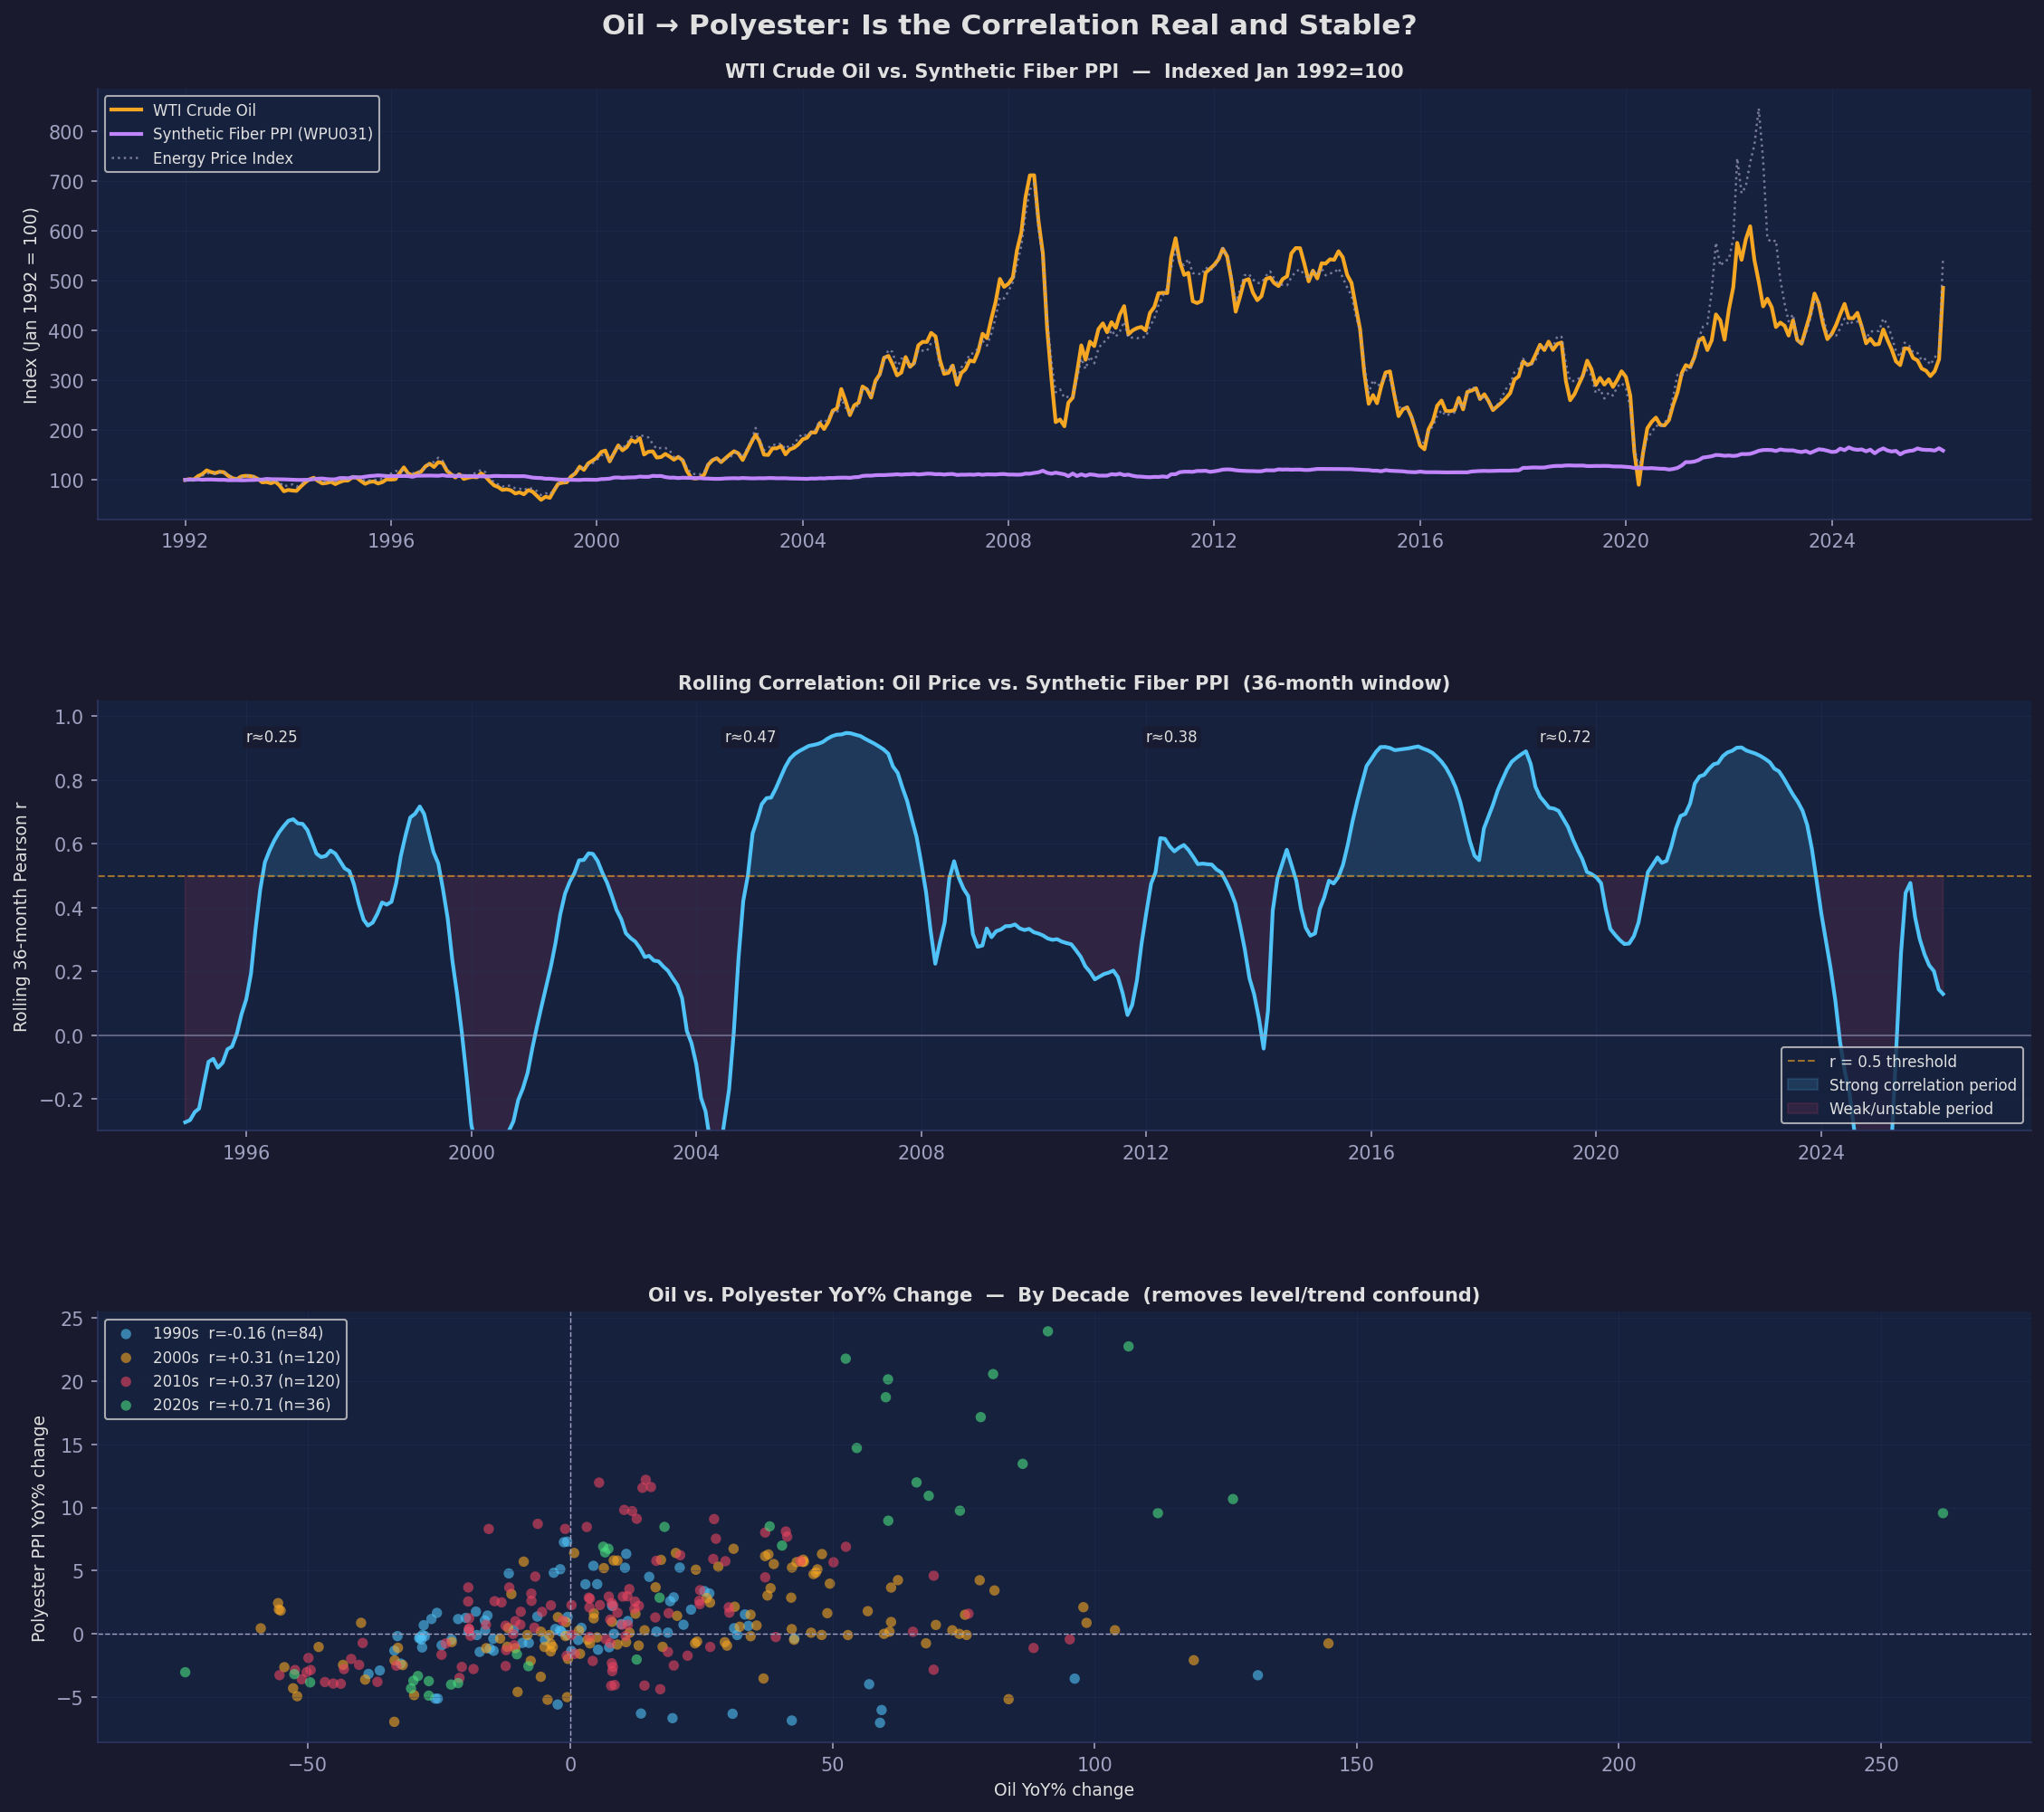
Fig. II Cotton Price Anatomy: Key Events, 1992–2022 · Annotated
Cotton price anatomy with annotated events

Each spike in cotton's price traces back to a discrete external event — none of which has a polyester equivalent. The 2010–2011 China government stockpile program drove the A-index to $5.06/kg, an all-time record. The 2014 reversal, when China released reserves, crashed prices just as violently. Source: World Bank, USDA, annotated from FRED PCOTTINDUSDM.

The Oil
Question

The intuitive assumption is that polyester prices track oil directly — oil → naphtha → PTA → PET fiber. The manufacturing chain is real, and raw material costs represent roughly 60–70% of polyester production cost. But the correlation is non-stationary, and understanding when it's strong versus weak is where the actual signal lives.

1992–2000: Correlation near zero. China's polyester industry was in massive expansion, growing production capacity regardless of oil cost. Overcapacity overwhelmed the raw material cost signal entirely.

2001–2008: Very strong. Oil moved from $25/bbl to $130/bbl — a move so large it couldn't be absorbed or hedged away. Polyester tracked oil closely across the entire period.

2009–2015: Weakened significantly. Post-GFC, the US shale revolution suppressed oil price volatility. Chinese polyester capacity continued expanding aggressively, compressing margins further. Still positive but noisier.

2016–2022: Strong again. When oil made large sustained moves — COVID collapse in 2020, then the 2021–2022 surge — polyester followed with a lag. The consistent rule across all periods: when oil spikes 30%, polyester typically rises ~12%. The pass-through is real but partial, always lagged, and only meaningful above ±15–20% crude movement.

The actionable implication: oil is a useful leading indicator for polyester cost pressure only when making a large, sustained directional move. Noise below that threshold rarely shows up in fiber pricing.

Fig. III Oil → Polyester Correlation Analysis · Rolling Windows · 1992–2022
Oil to polyester rolling correlation

Rolling correlation between crude oil price and synthetic fiber PPI (FRED WPU031). The non-stationarity is clear: near-zero in the 1990s expansion era, strong during the 2001–2008 oil supercycle, weakened post-GFC, strong again 2016–2022. Understanding when the correlation is live versus dormant is the actual signal.

Actionable Direction

What to Do
With This

01

Cotton price spikes are not random — they cluster around a predictable set of triggers: Chinese policy shifts, Pakistan monsoon, Xinjiang supply disruption, US crop competition. Build a watch list for these signals. A spike is visible before it hits your sourcing cost.

02

When oil makes a sustained move above 20–25%, expect polyester cost pressure in 2–4 months. This is a usable lead time for sourcing decisions and collection pricing. Movements below that threshold are noise.

03

The cotton volatility story is a positioning opportunity. Brands using cotton as a premium, naturals-forward narrative have structural pricing power that polyester-heavy competitors lack. The 72% premium is a cost disadvantage and a marketing asset simultaneously.

04

Natural fiber share at 22% and falling is near the floor for a pendulum reversal. Cultural sustainability pressure, EU textile regulation, and microplastics backlash all point toward eventual cotton recovery. Watch Chinese policy normalization as the first signal.